

Vanya Developer
4.0
ratings10 MB
SizeVerified
SCREENSHOTS (8)

About the app
Market Technical Indicators is a powerful and comprehensive app designed for traders and investors who want to stay on top of the stock market. With its user-friendly interface and up-to-date technical analysis tools, this app provides an extensive range of market data and charts for a variety of stocks and indices.
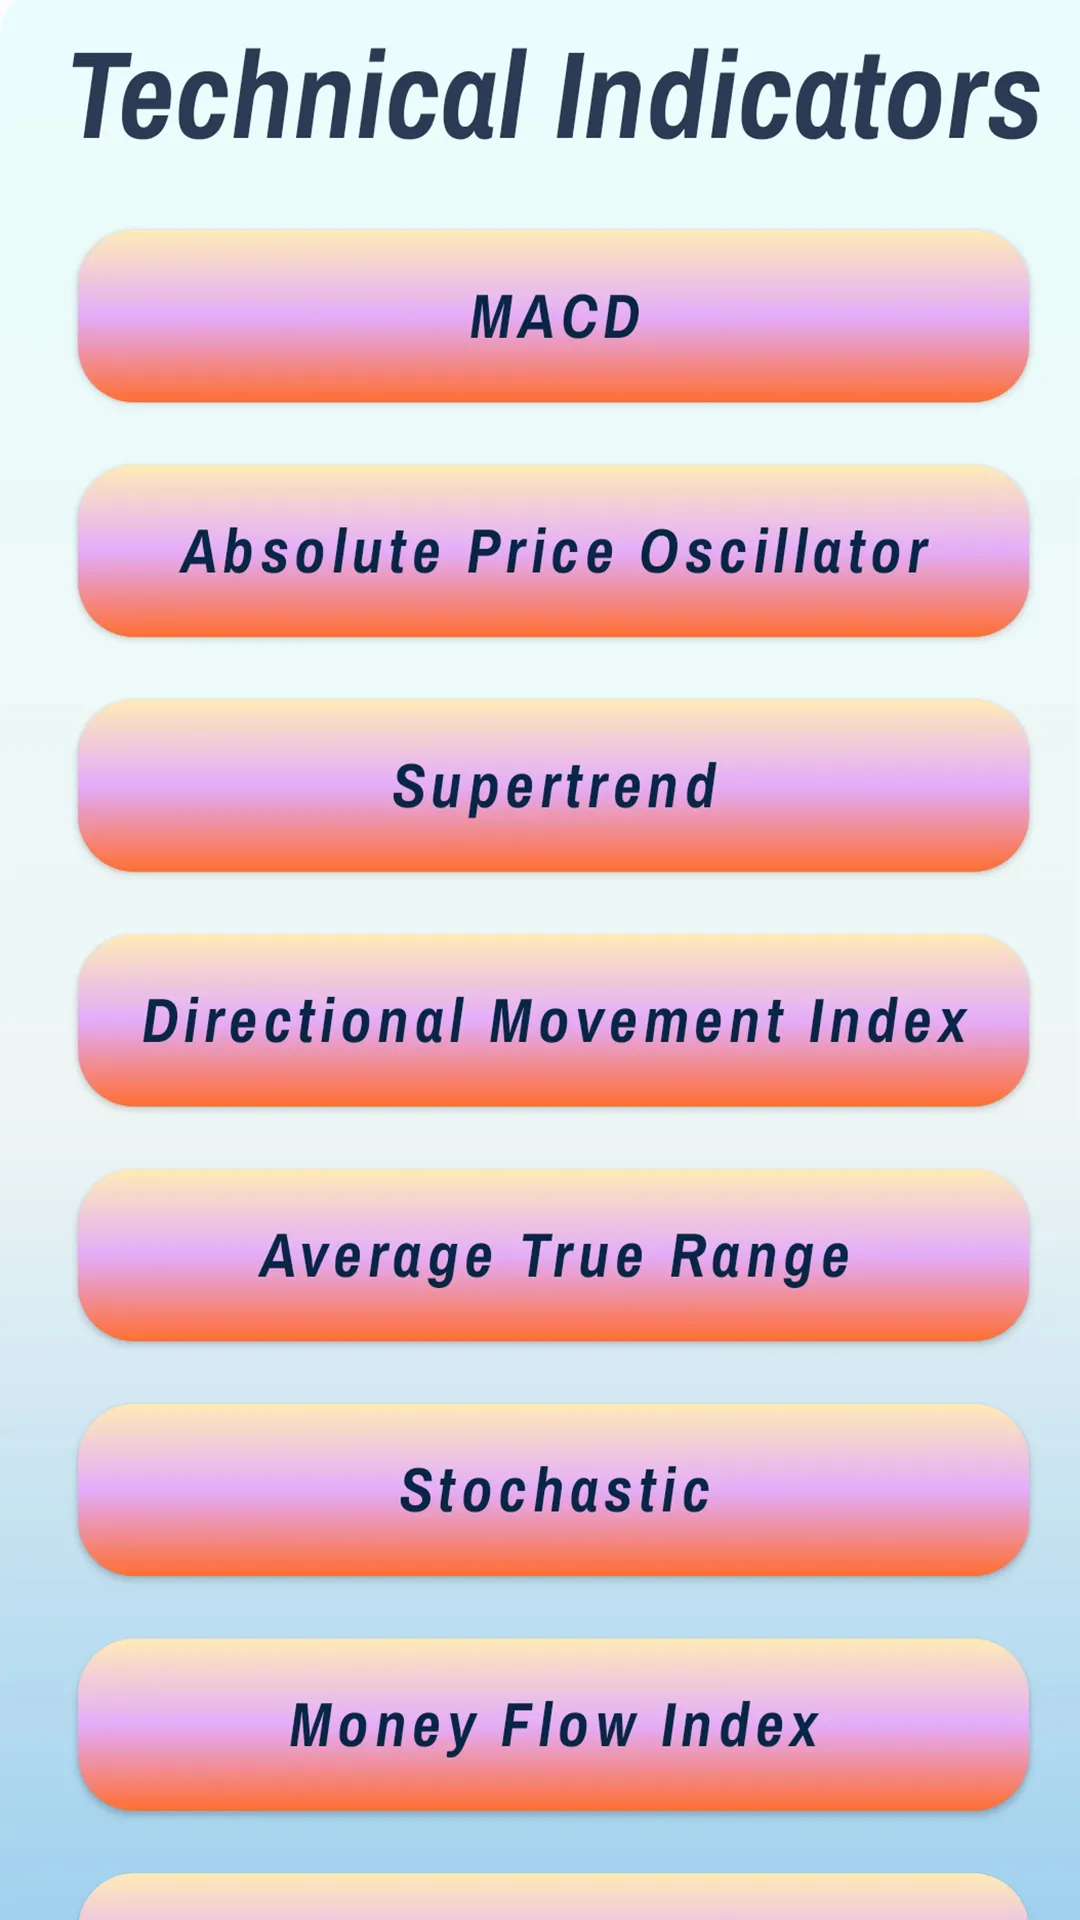
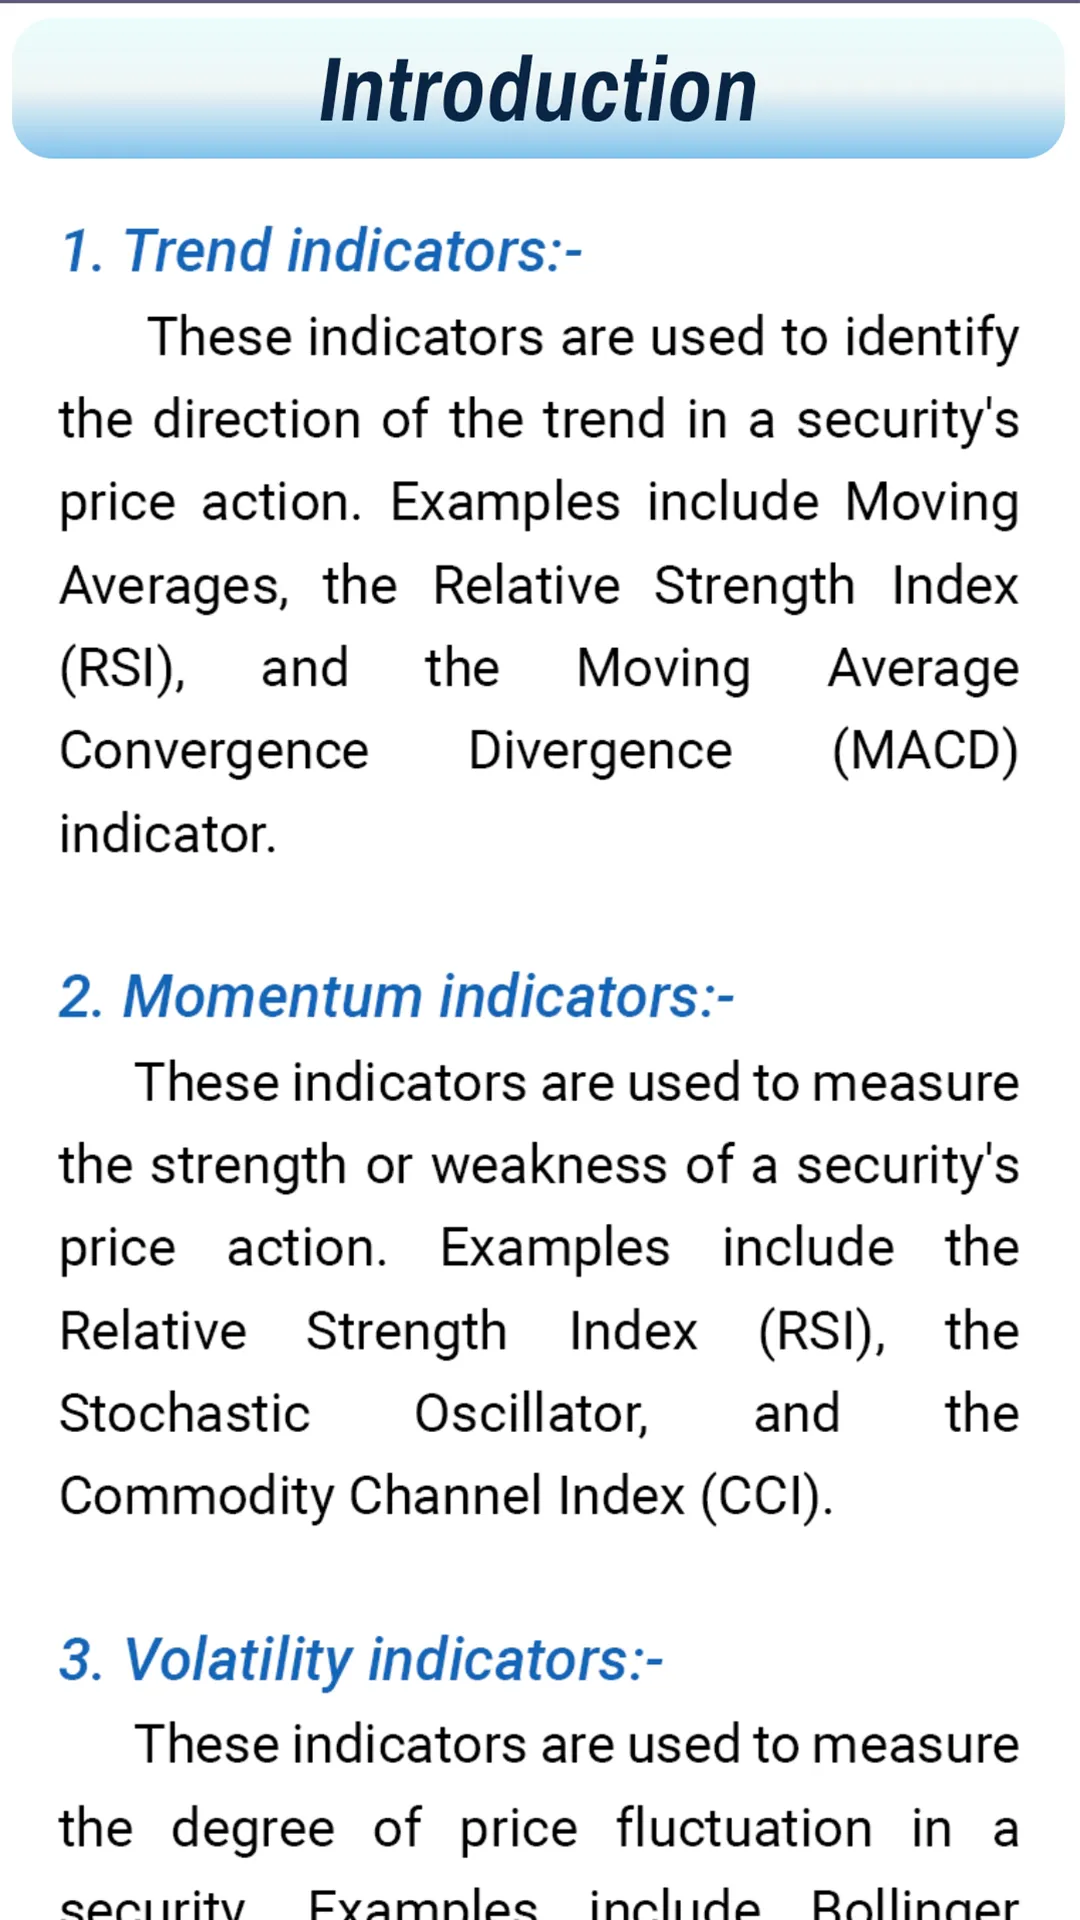
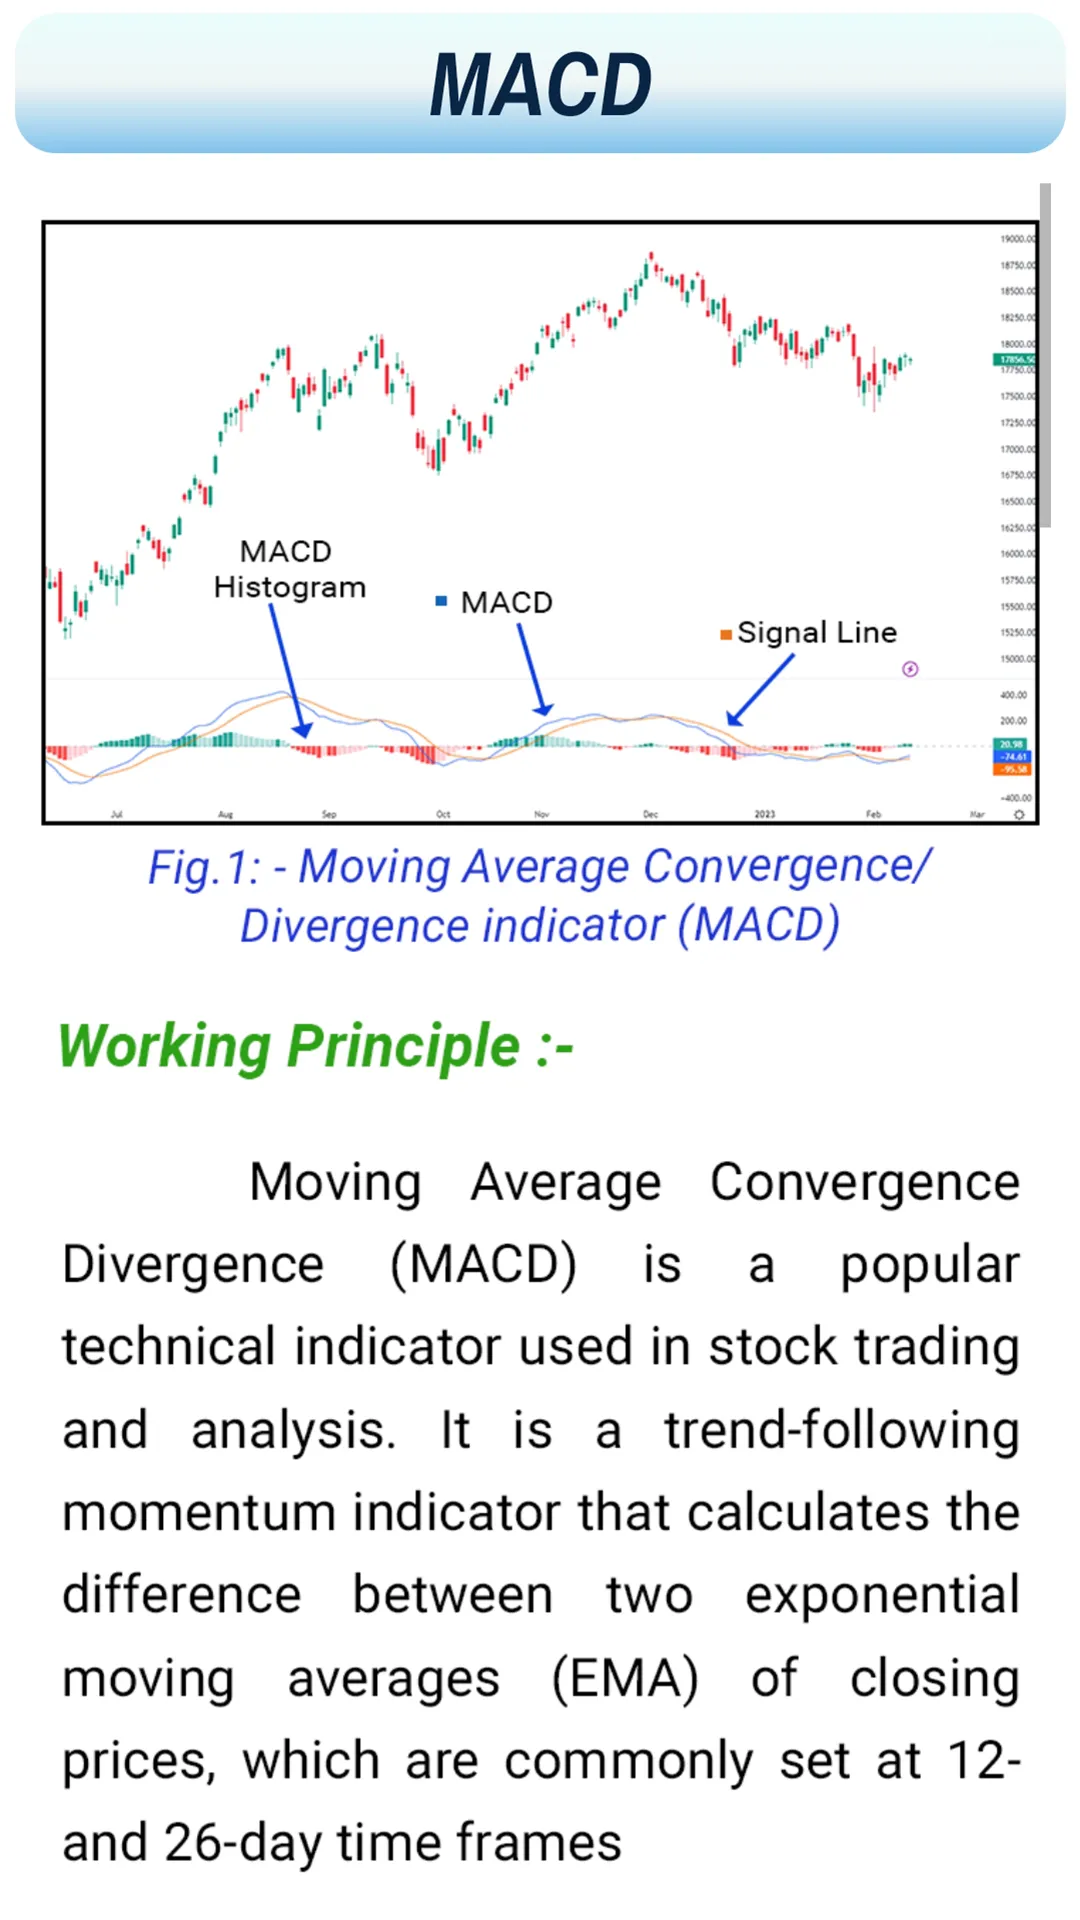
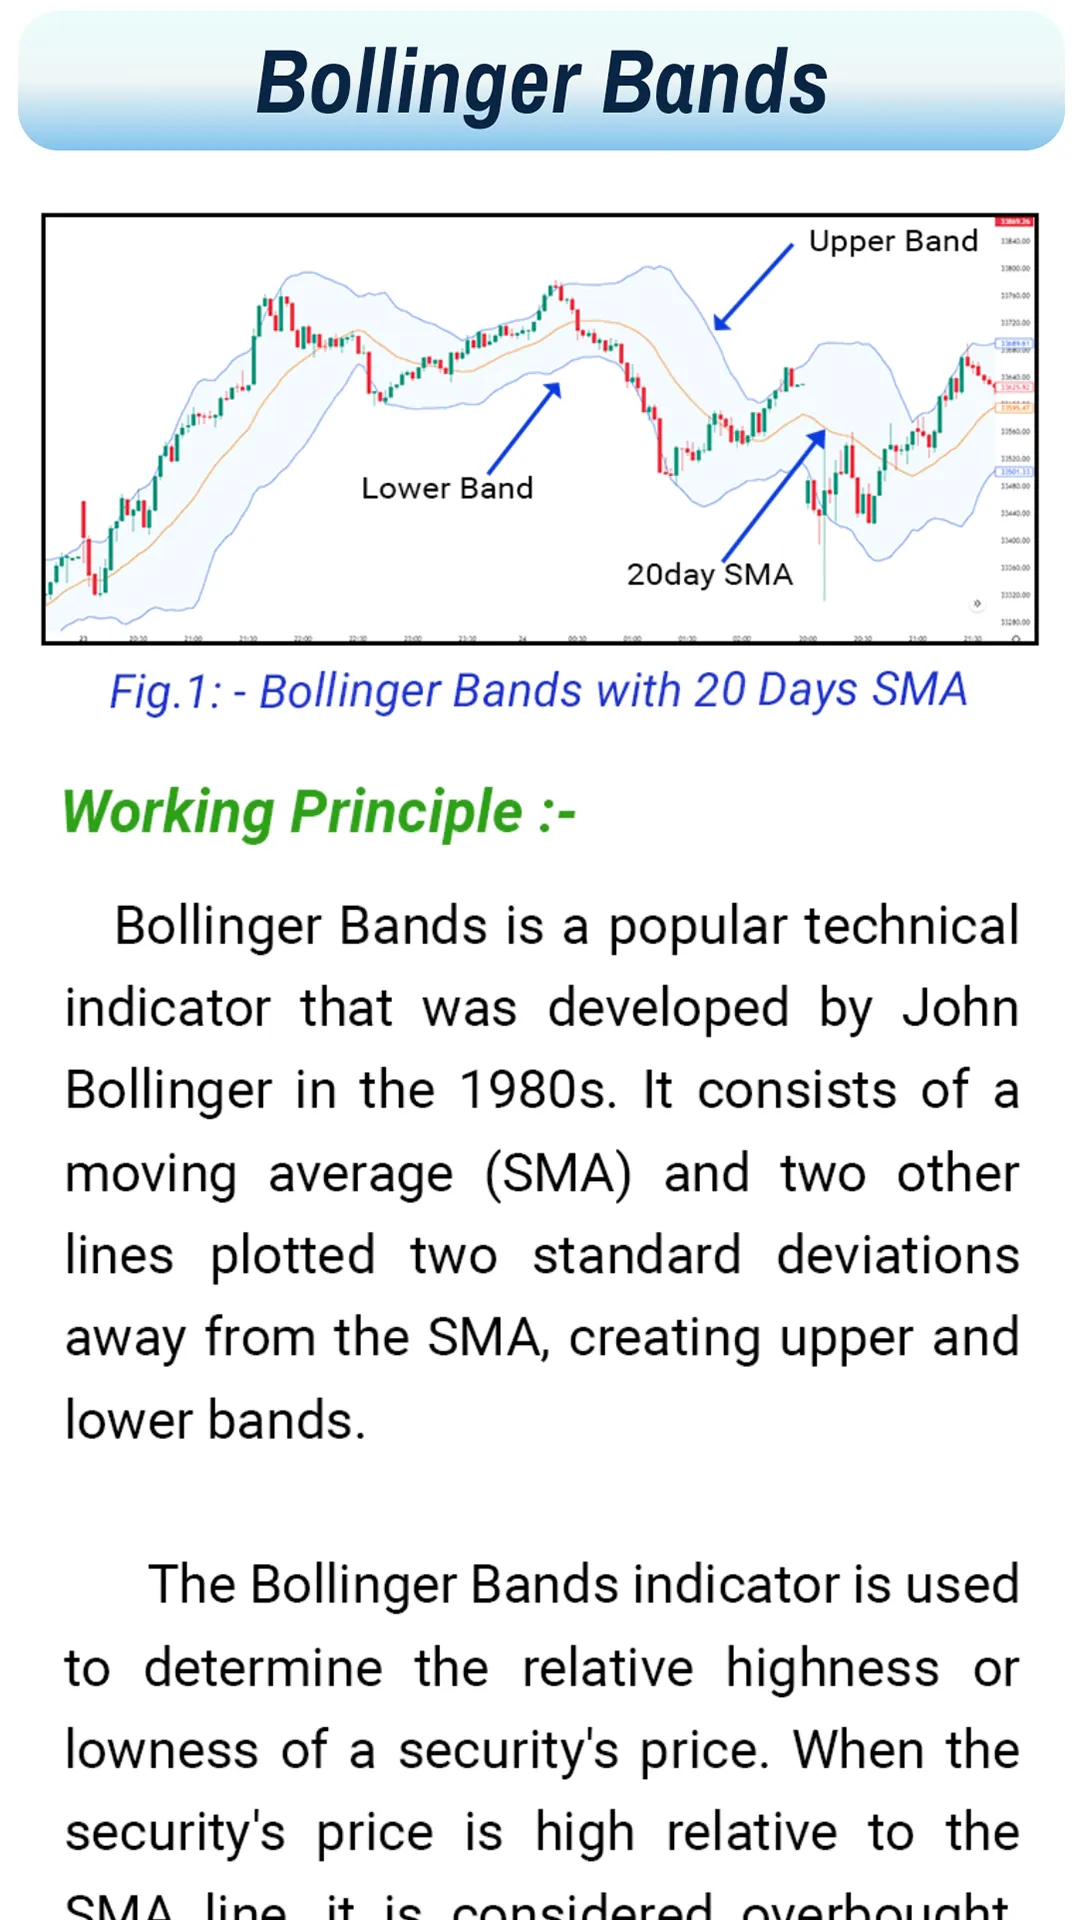
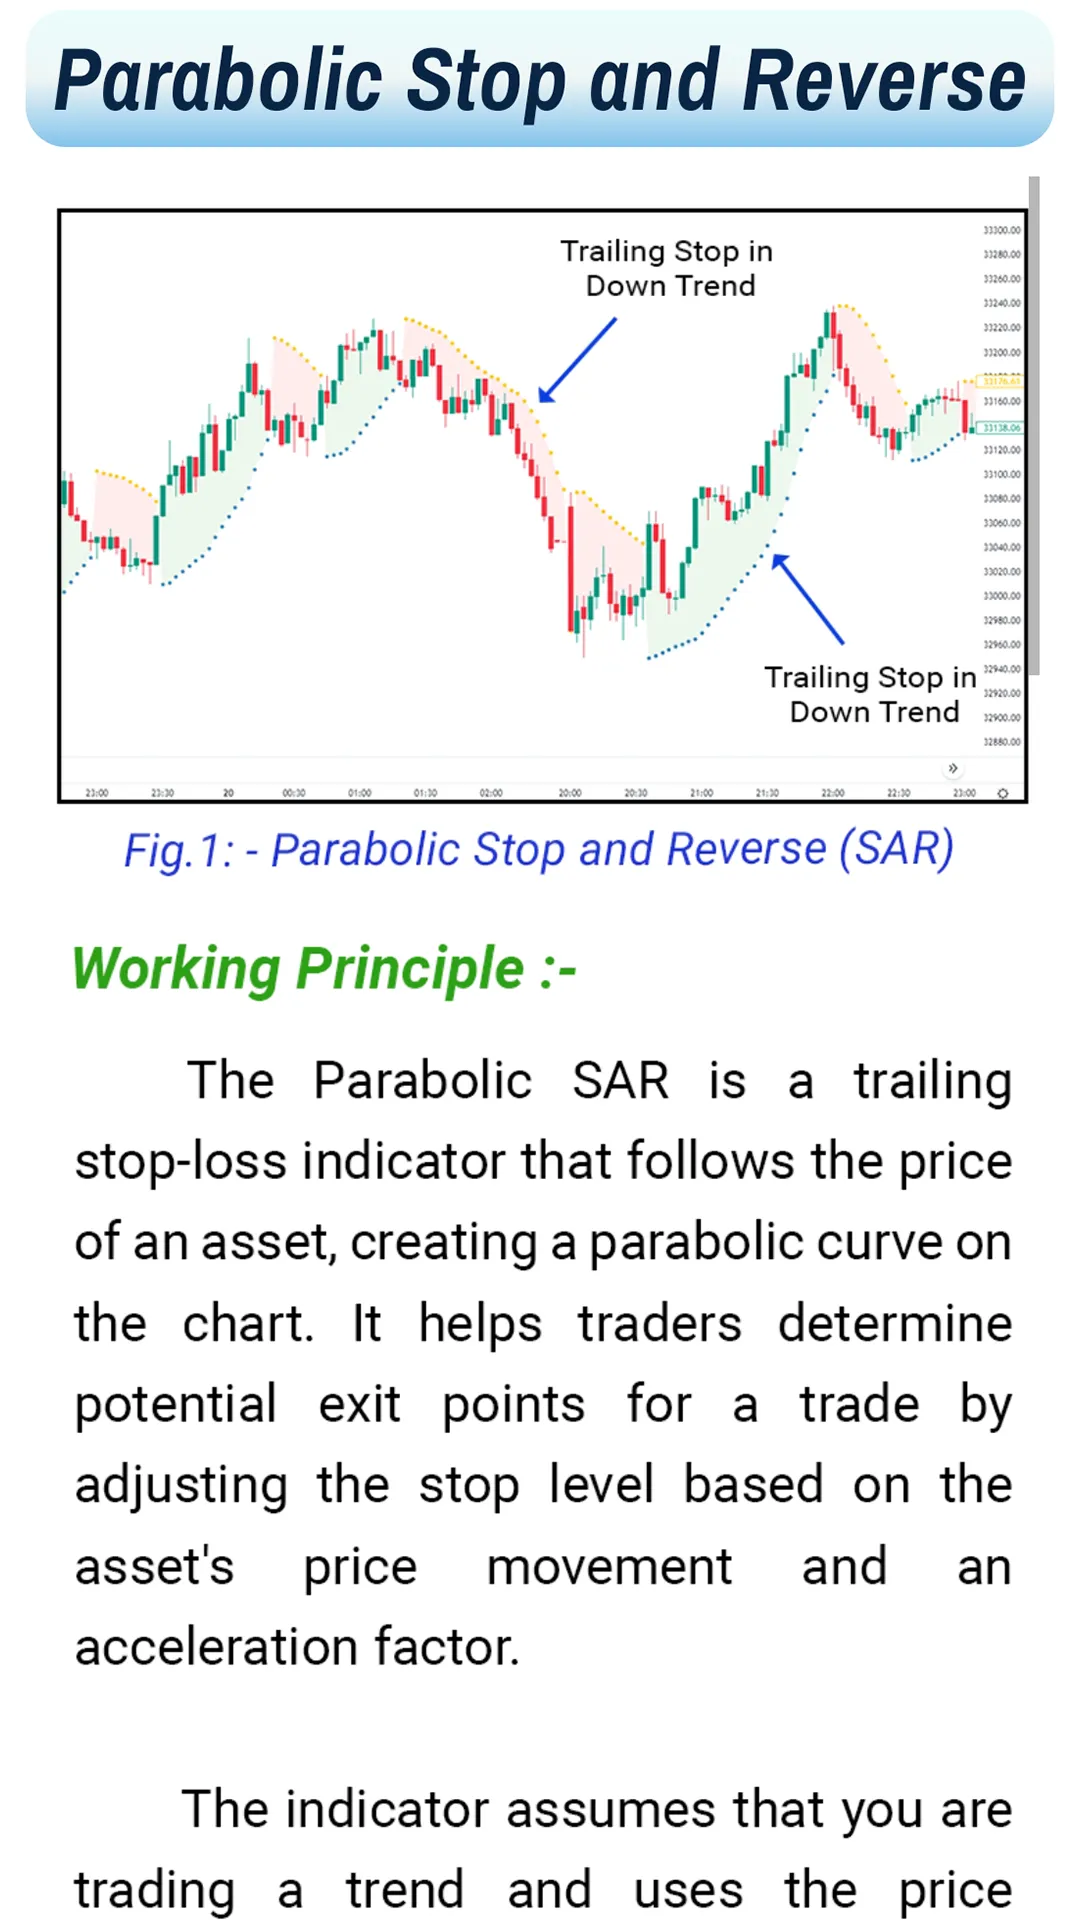
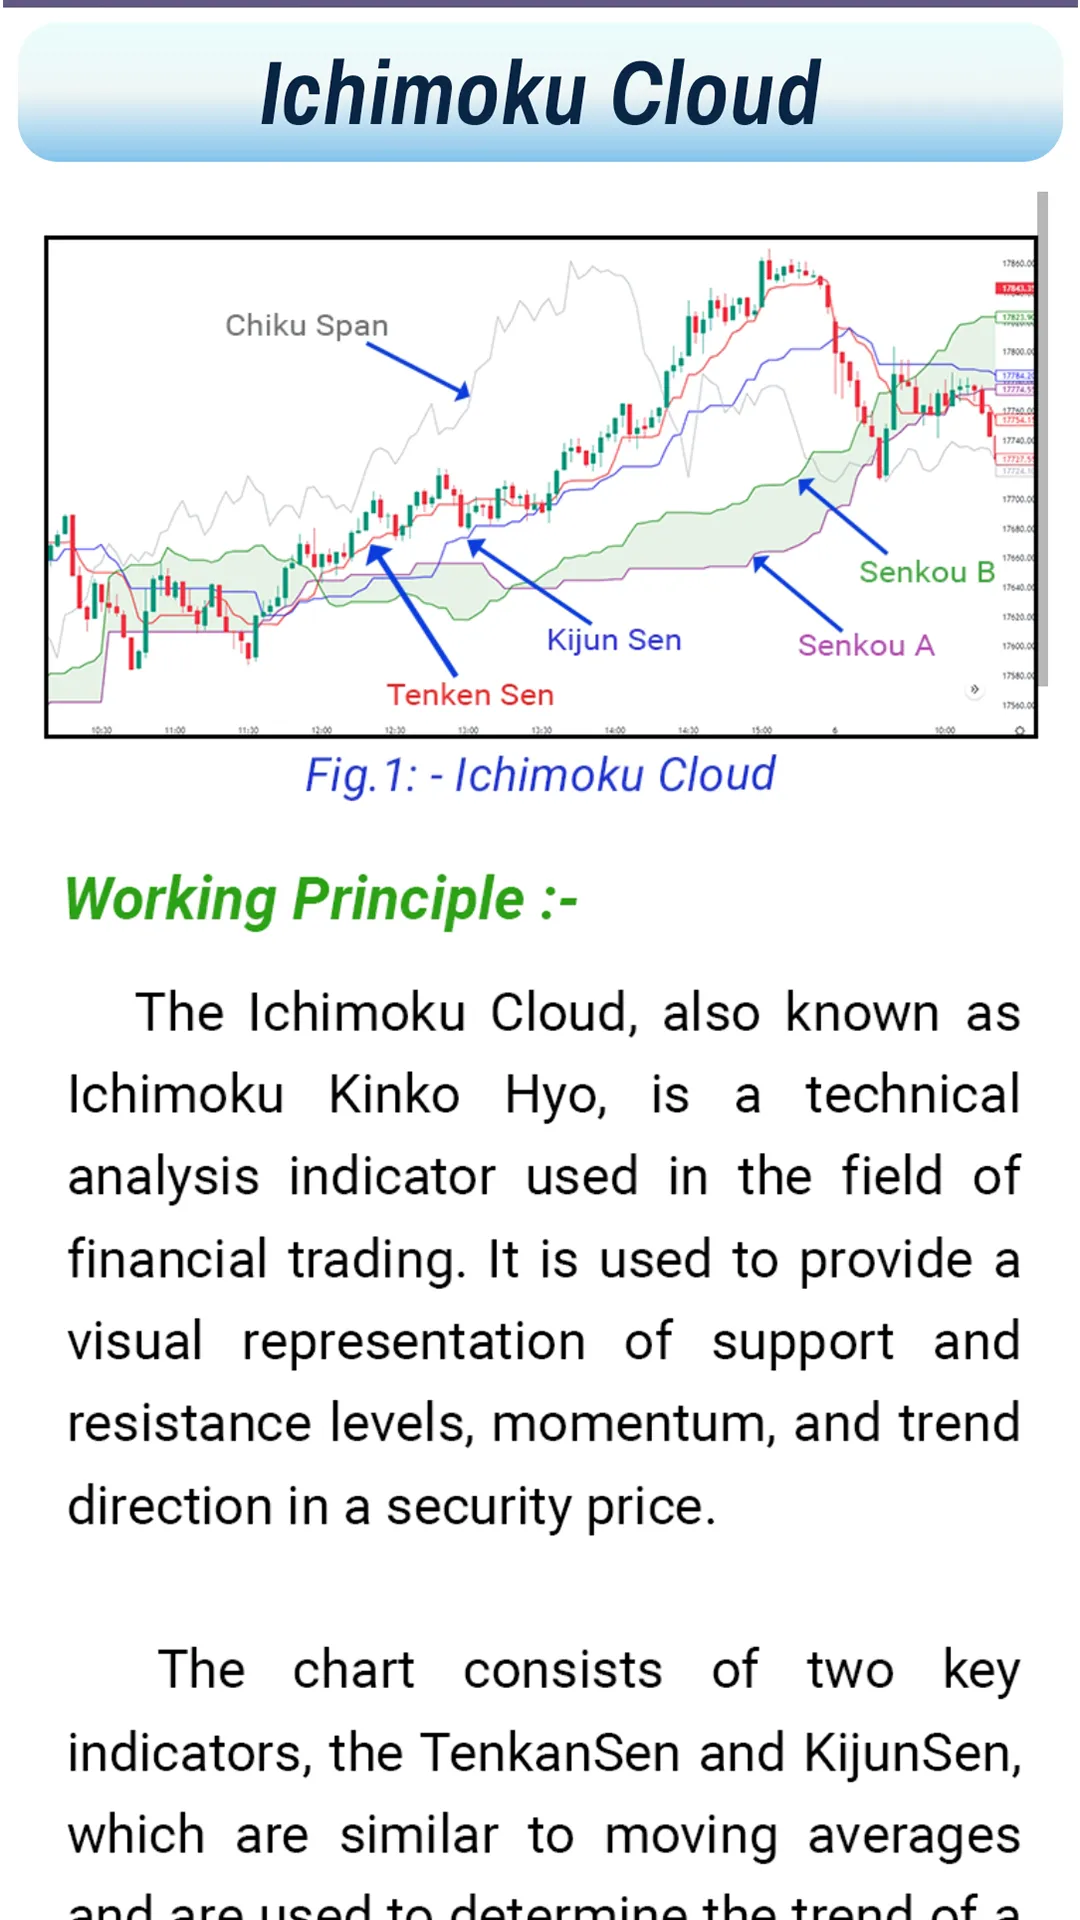
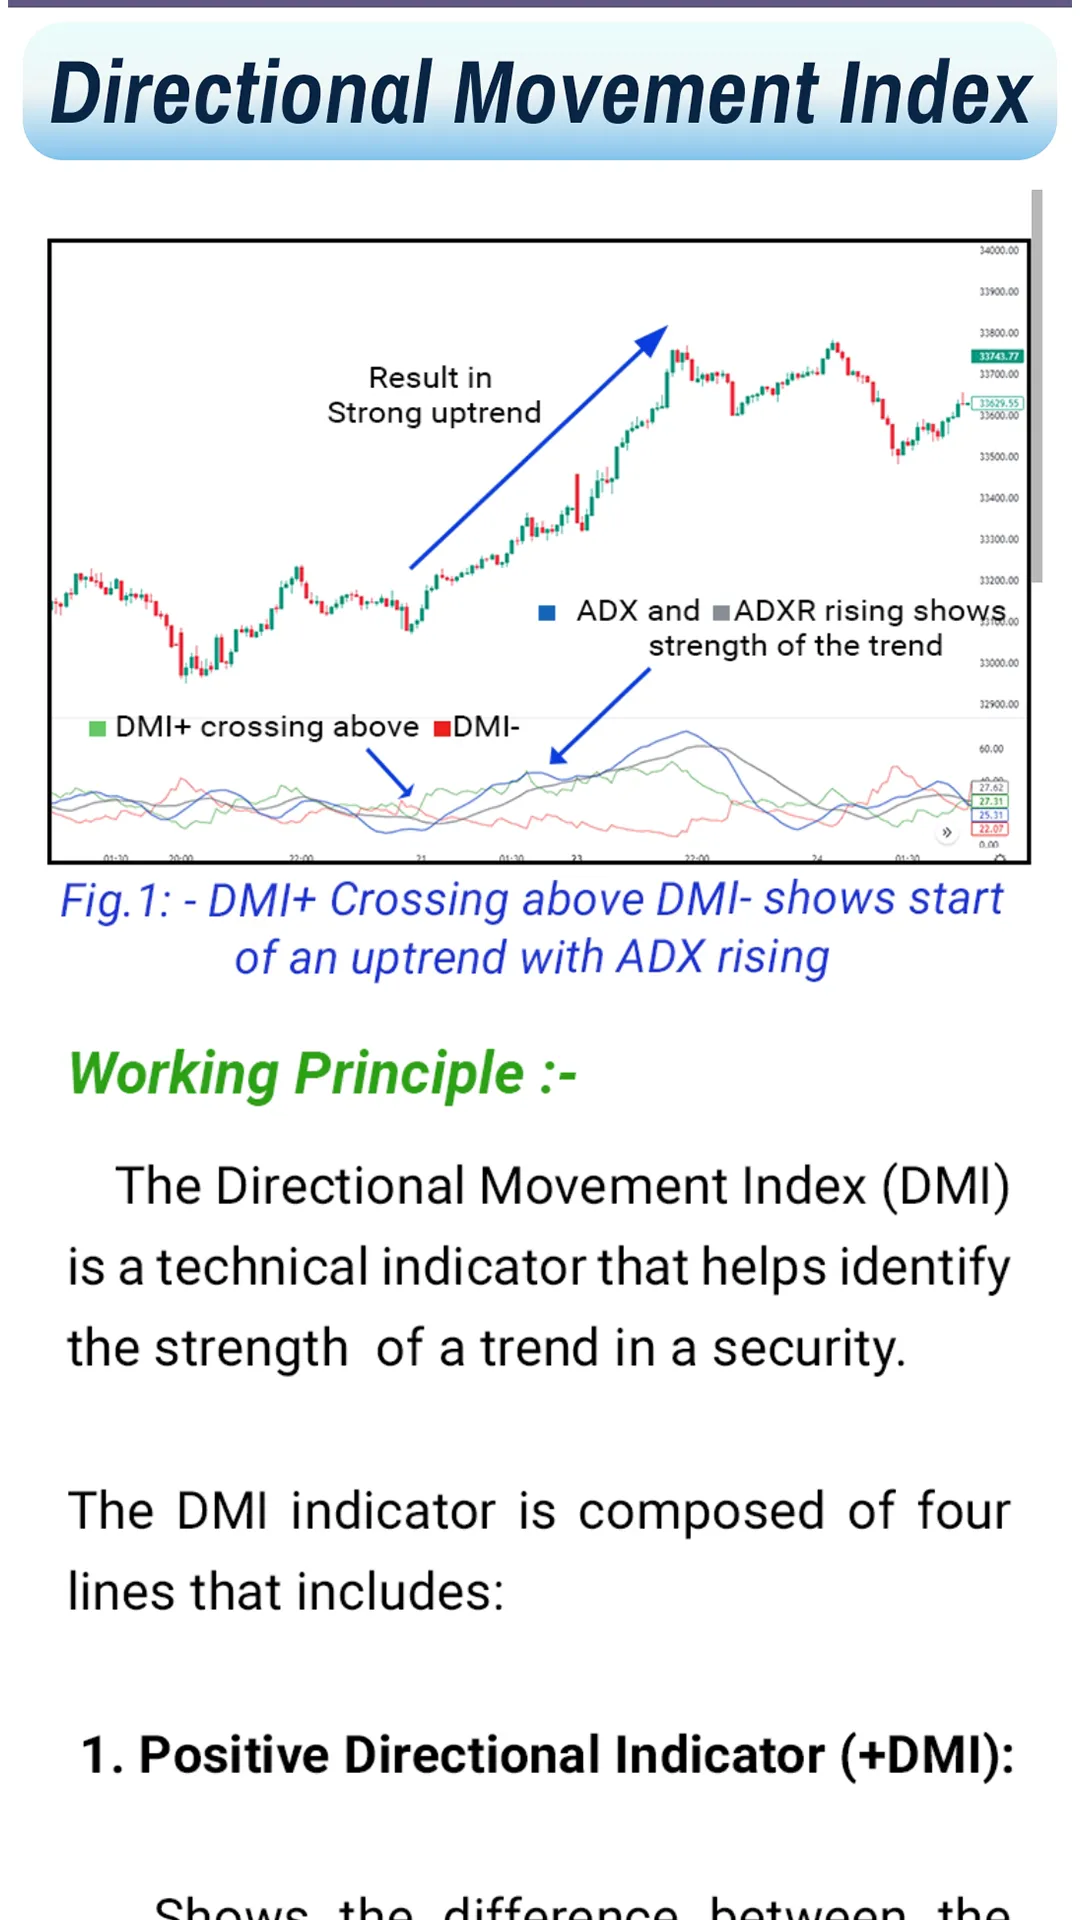
The app explains a wide range of technical indicators, such as moving averages, Bollinger Bands, Relative Strength Index (RSI), MACD (Moving Average Convergence Divergence), and many more. These indicators help traders to identify trends, patterns, and potential entry and exit points for a particular stock.
Market Technical Indicators is perfect for both beginners and experienced traders, as it provides a wide range of technical analysis tools and educational resources. The app is designed to be easy to understand, with Real life charts.
Whether you're a day trader, swing trader, or long-term investor, Market Technical Indicators is the perfect app to help you navigate the stock market. With its advanced technical analysis tools. Download the app today and take control of your trading journey!
Happy Learning
This App is completely free of charge. Learn and help others a profitable in stock market.
All the best. Please don't forget to rate us.
Education
Ratings
0
0 total ratings
5
73%
4
10%
3
4%
2
3%
1
10%
REVIEWS
No reviews yet. Be the first one to review this app

Permissions
Storage: access photos, media, and files on your device
Internet: use your internet connection
Phone: make and manage phone calls
Curated for YouSee all






Scan to download on PhonePe Appstore